Every Crypto We Track Scored 'Buy' All October. All 16 Fell — 61 of 64 Ten-Day Windows Lost Money.
All figures come from our own daily snapshots. We track 20 crypto assets; 16 of them produce daily rows. SUI, PEPE, HYPE and TON currently return no data, and our methodology lists them as known gaps.
The board said "Buy" every single day
On October 12 all 16 coins scored 79 or higher. On October 29 all 16 still did. The average crypto score never dropped below 88.3 on any October snapshot and peaked at 95.8.
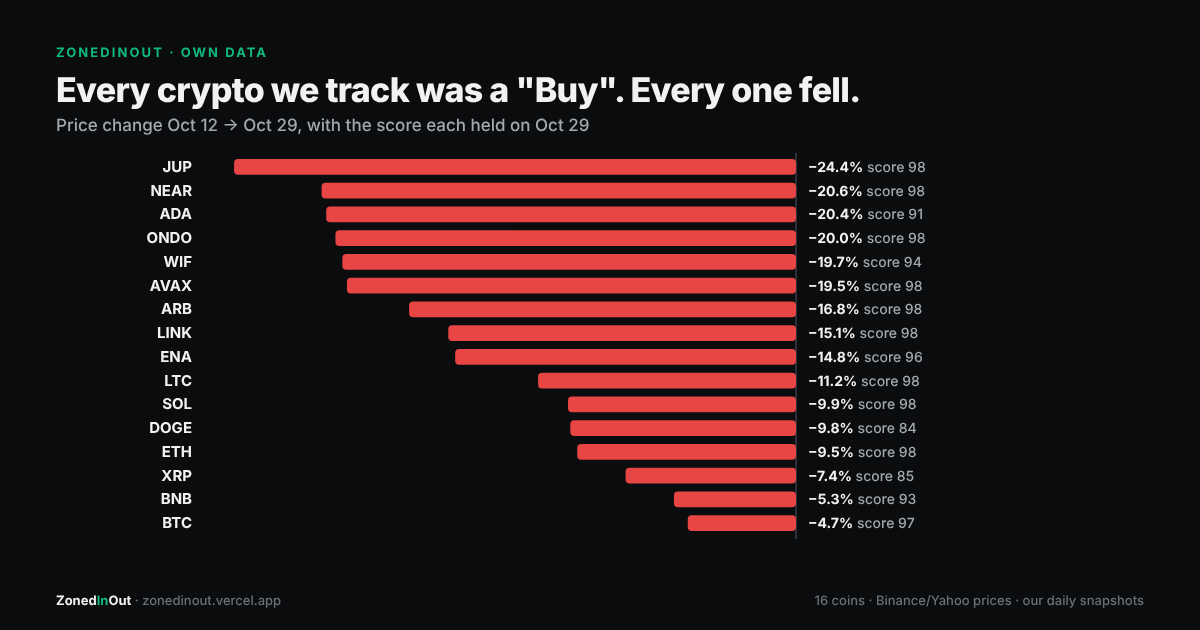
Meanwhile every one of them fell:
| Coin | Oct 12 → Oct 29 | Score on Oct 29 |
|---|---|---|
| JUP | −24.4% | 98 |
| NEAR | −20.6% | 98 |
| ADA | −20.4% | 91 |
| ONDO | −20.0% | 98 |
| WIF | −19.7% | 94 |
| AVAX | −19.5% | 98 |
| ARB | −16.8% | 98 |
| LINK | −15.1% | 98 |
| ENA | −14.8% | 96 |
| LTC | −11.2% | 98 |
| SOL | −9.9% | 98 |
| DOGE | −9.8% | 84 |
| ETH | −9.5% | 98 |
| XRP | −7.4% | 85 |
| BNB | −5.3% | 93 |
| BTC | −4.7% | 97 |
Bitcoin went from $82,559 to $78,673. It's now about 29% below its 52-week high of $110,640.
The hit rate, graded
We checked every crypto snapshot that scored 79+ against the price ten sessions later. There were 64 such windows in October. Three finished higher. 61 lost money. The average 10-session result was −8.40%.
Why the score got stuck at the top
The score's main input is how far price sits below its 20-day average, measured in ATR (average true range, a volatility unit). In a slow, steady decline, price stays below that average every day, so the score pins near its maximum. In that situation a 98 means "it's still falling," not "it's cheap."
The score does have trend inputs: the 200-day average direction (worth up to ±6 points) and RSI. But they're small weights, and in October they weren't enough to pull crypto out of the Buy band.
What to do with a pinned score
- Look at the 20-day change, not just the score. BTC's 20-session return on Oct 29 was −5.1%, ETH's −9.9%, SOL's −12.1%. A Strong Buy with a falling 20-day line is a knife, not a discount.
- A score that never moves is information. If a coin has sat at 95+ for two weeks, the market isn't bouncing it.
- Size down. Our own exit backtest found that most Buy Zone entries hit the stop before the first target, even in normal markets.
This is the same pattern our stock tiers showed in October (see our score-tier audit), only stronger in crypto.
Scores in this piece come from the ZonedInOut model. How the score works →
Frequently asked
Why did ZonedInOut rate Bitcoin a Strong Buy while it was falling?
How did crypto Buy signals perform in October 2026?
How can I tell a real dip from a falling knife on the board?
Get the Sunday Brief
One email a week, before the open: what the board did, which calls worked, which didn't, and what changed. Free. No spam, unsubscribe anytime.