In October, Our Highest Scores Did the Worst and Our Lowest Did the Best. Here's the Data.
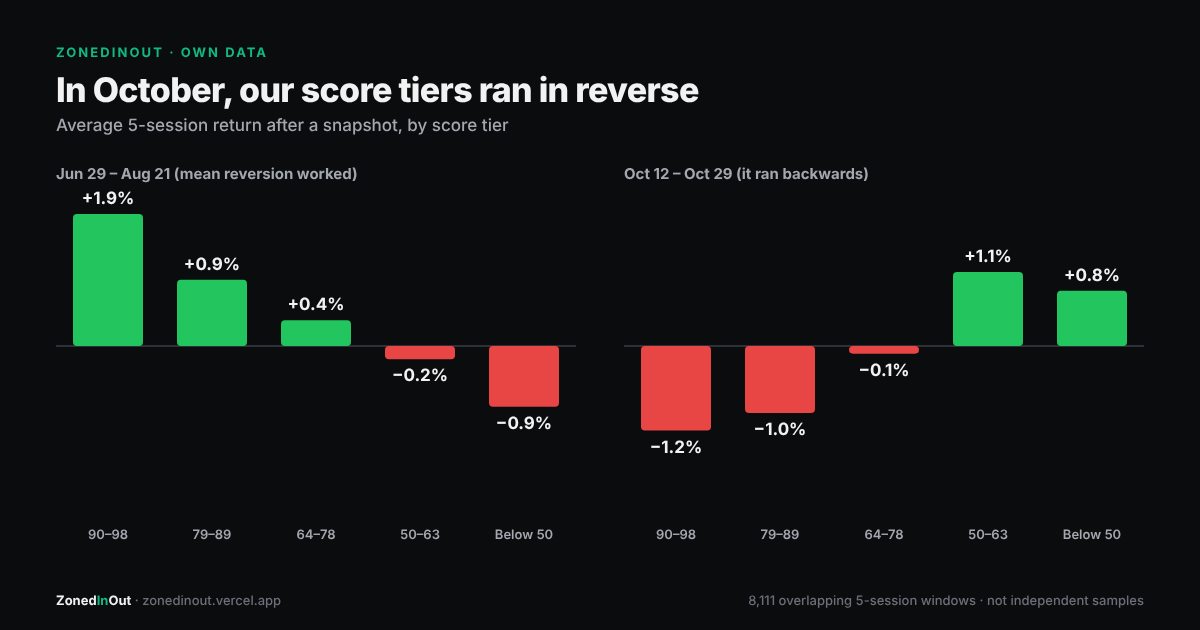
Every number here comes from our own daily snapshot archive (data/score-history.json): 54 trading days, about 218 assets a day. We graded each snapshot against what the price did over the next 5 sessions. Windows overlap, so these are not independent samples, and October is only 14 sessions. Read it as a description of what happened, not a law.
The summer: the score did its job
From June 29 to August 21, our score tiers lined up in the order they're supposed to. The higher the score on a given day, the better the next five sessions went on average.
| Score tier | Jun 29 – Aug 21: avg 5-session return | Win rate | Oct 12 – Oct 29: avg 5-session return | Win rate |
|---|---|---|---|---|
| 90–98 (Strong Buy) | +1.89% | 61.5% | −1.21% | 41.4% |
| 79–89 (Buy) | +0.95% | 55.0% | −0.96% | 48.3% |
| 64–78 | +0.37% | 51.5% | −0.11% | 59.3% |
| 50–63 (Extended) | −0.19% | 47.5% | +1.06% | 67.8% |
| Below 50 (Avoid) | −0.87% | 39.9% | +0.79% | 66.9% |
That's 6,149 graded windows in the summer and 1,962 in October.
October: the same ladder, upside down
From October 12 to 29 the order flipped almost perfectly. Strong Buys lost 1.21% on average over the next five sessions. Names we labelled Extended gained 1.06%. Over 10 sessions the gap got wider: the 90–98 tier averaged −3.18% (35.8% positive), while 50–63 averaged +1.38% (68.9% positive).
In plain terms, October rewarded momentum, not mean reversion. Stocks that had already run kept running. Stocks that had pulled back kept falling. A score that measures how far price has pulled back below its 20-day average is the wrong tool in that kind of tape.
It started while our data was down
Our daily pipeline was down from August 22 to October 11. We disclosed that outage at the time. We can still compare the last snapshot before it with the first one after. Of the 193 assets we had on both dates:
- Names scored 90+ on August 21 had a median of −2.7% by October 12.
- Names scored 63 or below had a median of +1.1%. Their average was +8.3%, but a few crypto alts (NEAR +162%, ARB +86%) skew that number.
- SPY rose 1.6% over the same gap.
So it's not only 14 noisy October days. Pulled-back names have lagged extended ones for about ten weeks.
Eleven names were "Strong Buy" every day of October. All eleven fell.
These were scored 90 or higher on every one of the 14 October snapshots:
| Name | Oct 12 → Oct 29 |
|---|---|
| MARA | −24.0% |
| CBRS | −21.5% |
| AVAX | −19.5% |
| RIVN | −15.4% |
| LINK | −15.1% |
| SMCI | −13.9% |
| SNDK | −10.6% |
| ARM | −10.4% |
| SOL | −9.9% |
| INTC | −9.2% |
| SMH | −5.0% |
SPY was −1.1% over the same dates. A score that stays at the top while price keeps falling isn't a "still cheap" signal. It's telling you price is still sliding under its average every day. That's a trend, not a dip.
What we're doing about it
We're not changing the model on 14 sessions of data. A score that flips its rules every time the regime changes would be worse than one that's wrong for a month. What we're doing:
- Publishing this, so you know the board's top tier has had a bad stretch.
- Watching the per-row falling-knife warning, which flags exactly this pattern.
- Re-running this same table at the end of November with more data.
How the score is built: methodology.
Scores in this piece come from the ZonedInOut model. How the score works →
Frequently asked
Did ZonedInOut's Strong Buy signals work in October 2026?
Did the score work before October?
Why would a mean-reversion score fail?
Is ZonedInOut changing its model because of this?
Get the Sunday Brief
One email a week, before the open: what the board did, which calls worked, which didn't, and what changed. Free. No spam, unsubscribe anytime.