The 10-Year Yield Hit 5.24% While Our Data Was Down. Stocks Rose Anyway. Here's What Moved.
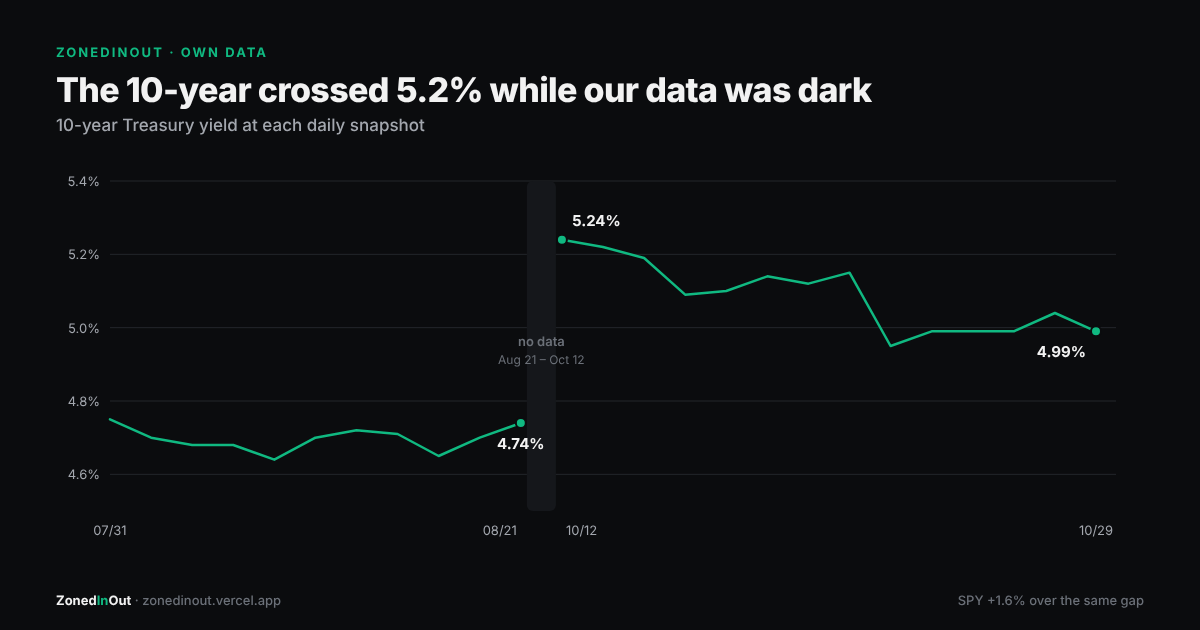
Our daily data pipeline was down from August 22 to October 11 (we covered that publicly). This piece compares our macro snapshot just before it with the first one after, then follows October day by day. All figures come from our own macro history file.
Before and after the gap
| Aug 21 | Oct 12 | Oct 29 | |
|---|---|---|---|
| 10-year Treasury yield | 4.74% | 5.24% | 4.99% |
| 3-month T-bill | 3.71% | 4.05% | 4.00% |
| 10-year minus 3-month | +1.03 | +1.19 | +0.99 |
| Dollar index (DXY) | 98.84 | 102.58 | 101.91 |
| VIX | 15.13 | 15.21 | 17.20 |
| SPY | $765.72 | $778.10 | $769.36 |
The 10-year rose half a point during the gap, the 3-month bill rose about a third of a point, and the dollar gained almost 4%. SPY still finished the gap up 1.6%.
The FRED effective fed funds reading in our file moved from 3.63% (July) to 3.75% (September). Short-term rates didn't fall over this period; they edged up.
October: the yield backed off and stocks went sideways
The 10-year drifted from 5.24% down to 4.95% by October 22, and has stayed between 4.95% and 5.04% since. The VIX touched 19.99 on October 16 and 19.45 on October 23. It never got near the 25 level where our page-level macro caution banner switches on, and the yield curve stayed positive the whole time.
What our board shows on bonds right now
As yields came off their high, bond prices rallied, and our scores for the Treasury ETFs went into Avoid:
| ETF | Score | Signal | 20-session change |
|---|---|---|---|
| TLT (long Treasuries) | 46 | Avoid | +5.18% |
| IEF (7–10 year) | 46 | Avoid | +2.47% |
| TIP (inflation-protected) | 40 | Avoid | +2.24% |
| SHY (1–3 year) | 45 | Avoid | +0.65% |
That isn't a bearish call on bonds. "Avoid" means the price has run up above its 20-day average, so it isn't a pullback entry right now. If you wanted long bonds, the better entry was mid-October, when the 10-year was above 5.1%.
What's worth noticing
In September we wrote that the 10-year hitting 5% came with a falling stock market. Since then it went higher still, to 5.24%, and the S&P held up. Stocks have so far absorbed long-term rates above 5% without a big drawdown. It's mostly the largest names doing the absorbing, though (see our breadth piece). Our own app treats a 10-year above 4.75% as a hawkish backdrop, and every October snapshot has been above that line.
Scores in this piece come from the ZonedInOut model. How the score works →
Frequently asked
What was the 10-year Treasury yield in October 2026?
How did stocks react to the 10-year yield above 5%?
Why does ZonedInOut rate Treasury ETFs 'Avoid' right now?
Get the Sunday Brief
One email a week, before the open: what the board did, which calls worked, which didn't, and what changed. Free. No spam, unsubscribe anytime.