The S&P 500 Is 1% From Its High. Fifteen Fewer of Our Stocks Are Above Their 200-Day Than in August.
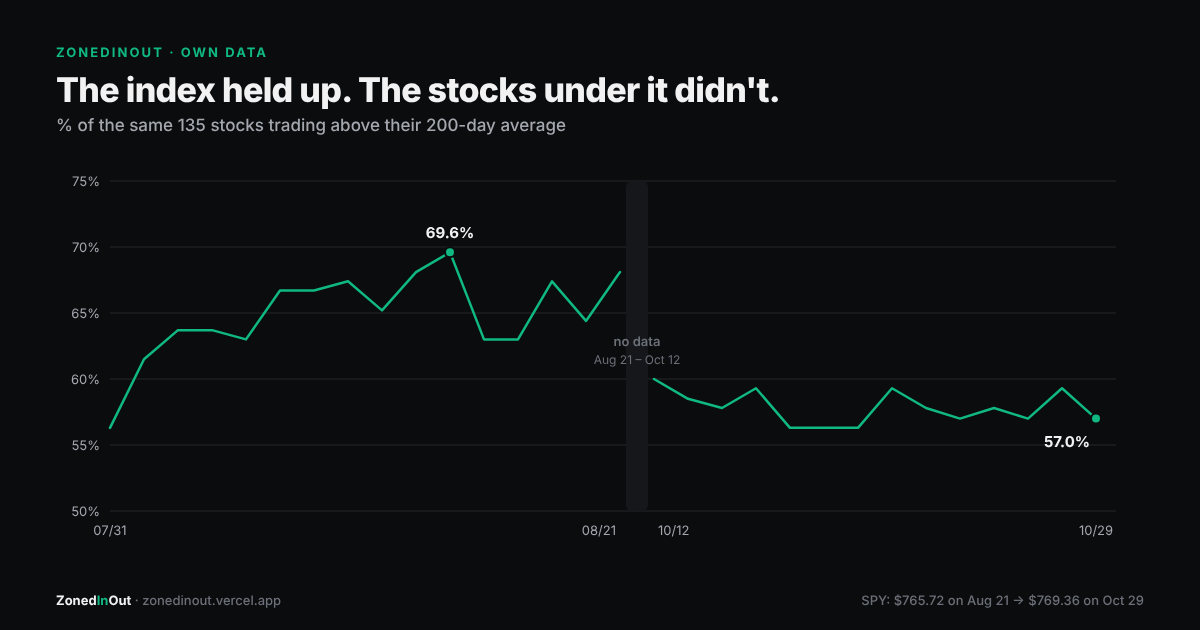
To keep this a fair comparison, we used the same 135 stocks every day: every stock in our universe on July 31 that had a 200-day average recorded. Names added later are left out, so newly added mid-caps can't drag the October number down.
The index barely moved
SPY closed at $765.72 on August 21 and $769.36 on October 29, up 0.5%. Its 52-week high is $779.09, so it's only 1.25% away. On the index alone, nothing much happened in two months.
Underneath, it got narrower
| Date | Share of the same 135 stocks above their 200-day average | SPY |
|---|---|---|
| Aug 14 | 69.6% (peak) | $776.34 |
| Aug 21 | 68.1% | $765.72 |
| Oct 12 | 60.0% | $778.10 |
| Oct 29 | 57.0% | $769.36 |
That's 92 stocks above their 200-day on August 21 and 77 on October 29. Fifteen names dropped below their long-term trend line while the index went up.
The shorter-term picture is softer too. 46.7% of the same stocks now trade below their 20-day average, compared with 43.0% on August 21.
Who's carrying it
A cap-weighted index can rise while most of its stocks don't, if the biggest ones do the work. On October 29, Apple closed at a 52-week high and Microsoft sat in our "strong trend" regime. Meanwhile Alphabet, Meta and Netflix were down 12–20% in October, and the small-cap Russell 2000 ETF (IWM) is down 4.8% over 60 sessions.
What this does and doesn't mean
It doesn't predict a crash. Narrow markets can stay narrow for a long time.
It does change how you read a "cheap" board. Our median score is 80 and 115 of 218 names (53%) are in the Buy Zone, which looks like a market full of discounts. But many of those discounts are stocks breaking down while a few large names hold the index up. That's the same mix that made our high scores do badly in October.
Practical check: before buying a Buy Zone name, see whether it's above its 200-day average. Our score gives a small bonus when it is. In a narrow market that bonus matters more than usual.
Scores in this piece come from the ZonedInOut model. How the score works →
Frequently asked
What share of stocks are above their 200-day moving average in October 2026?
Is the stock market rally narrowing?
Does weak breadth mean a crash is coming?
Get the Sunday Brief
One email a week, before the open: what the board did, which calls worked, which didn't, and what changed. Free. No spam, unsubscribe anytime.