Does the 200-Day Moving Average Matter? We Tested It on Our Own Data
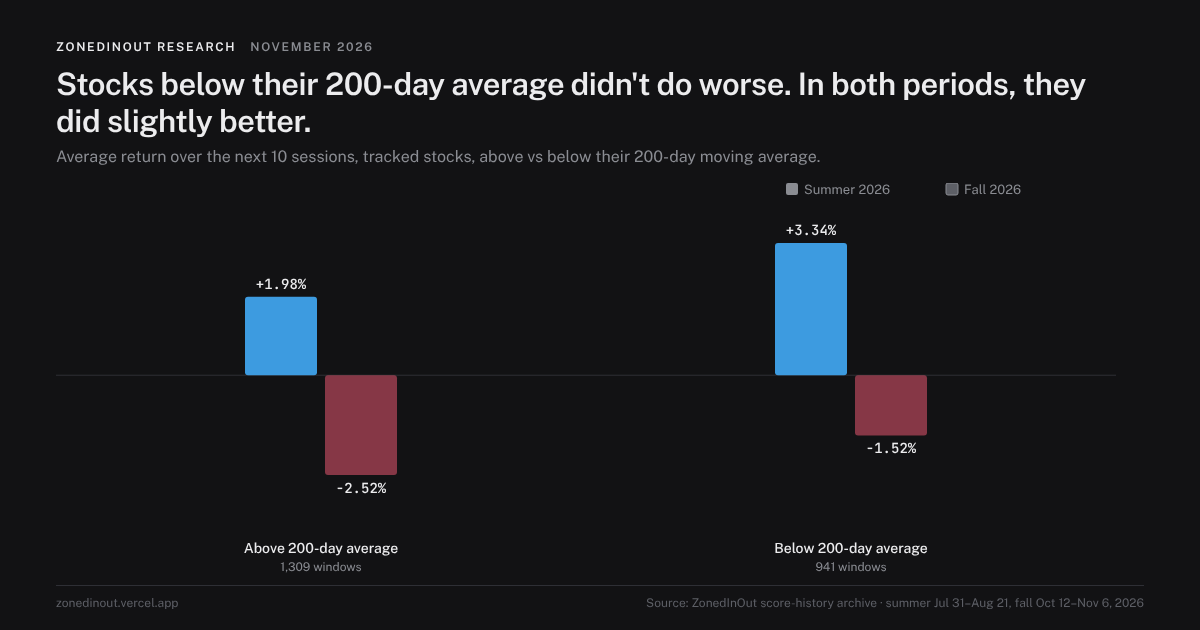
"Never buy a stock below its 200-day moving average" is one of the most repeated rules in investing. We tested it on our own archive. In our sample, it didn't hold up.
What the 200-day average is
It's the average closing price over the last 200 trading days, roughly 10 months. Above it, a stock is usually described as in a long-term uptrend; below it, in a downtrend. Many investors use it as a simple filter.
The test
For every tracked stock on every snapshot day where we had a 200-day average (from July 31, 2026), we checked whether it was above or below the line, then measured the next 10 sessions.
| Summer (Jul 31 – Aug 21) | Fall (Oct 12 – Nov 6) | All | |
|---|---|---|---|
| Above 200-day average | +1.98% (54% rose) | −2.52% (47% rose) | −0.78% (50% rose) |
| Below 200-day average | +3.34% (63% rose) | −1.52% (50% rose) | +0.05% (54% rose) |
In both periods, the stocks below the line did slightly better over the next two weeks, not worse.
Why that might be
- Two weeks is short. The 200-day rule is meant for long-term trend-following over months. Over 10 sessions, stocks below the line can bounce simply because they've been sold hard.
- This autumn punished former leaders. Many stocks above their 200-day average were AI names that had run up all year and then fell fastest in October and November.
- Small sample. About three months, with a gap from August 22 to October 11, and our tracked list leans toward growth stocks.
So should you ignore it?
No. Our result is narrow: over the next two weeks, in this sample, being above the line didn't help. That's different from saying the 200-day average is useless over a year. Longer studies by others have found trend filters can reduce drawdowns, mainly by keeping investors out of the worst of long bear markets.
The practical lesson is smaller: don't treat "above the 200-day" as a safety stamp in the short run. In November 2026, plenty of stocks above it fell hard.
How we use it
Our score gives a small bonus when a stock is above its 200-day average, and each stock page says plainly which side of the line it's on. Given this result, we're keeping that bonus small, and we'll re-run the test as the archive grows.
Data: ZonedInOut score-history archive. Not investment advice.
Scores in this piece come from the ZonedInOut model. How the score works →
Frequently asked
Does the 200-day moving average matter?
Should I avoid stocks below the 200-day moving average?
What is the 200-day moving average?
Get the Sunday Brief
One email a week, before the open: what the board did, which calls worked, which didn't, and what changed. Free. No spam, unsubscribe anytime.