Is It Over for the Stock Market? What History Says About November 2026
Updated November 6 with the November 5 close and the October jobs report.
Short answer: the record says no, not yet. What's happening is a sharp, AI-led correction inside a market that still has rising earnings behind it. Here is the evidence on both sides, with the numbers, so you can judge it yourself.
Where we actually are
- The S&P 500 set a record close of 7,818.93 on October 6. On November 5 it fell 4.36% to 7,353.73, its worst day since April 2025, leaving it about 5.9% below that record (NBC, StockTitan).
- The Nasdaq Composite fell 5.52% to 24,315.00, about 12% below its record. That's a correction by the textbook definition (10% or more). The Nasdaq-100 got there first, on November 2.
- The Dow lost 1,833 points (−3.44%), wiping out the previous day's rally, its best post-midterm day in 44 years. The Philadelphia semiconductor index fell more than 12%; Micron and AMD each lost about 17% (CNBC).
So the honest framing is: the Nasdaq is in a correction; the S&P 500 is in a 6% pullback that is not yet a correction. Calling it "over for the stock market" skips several steps.
How normal is this?
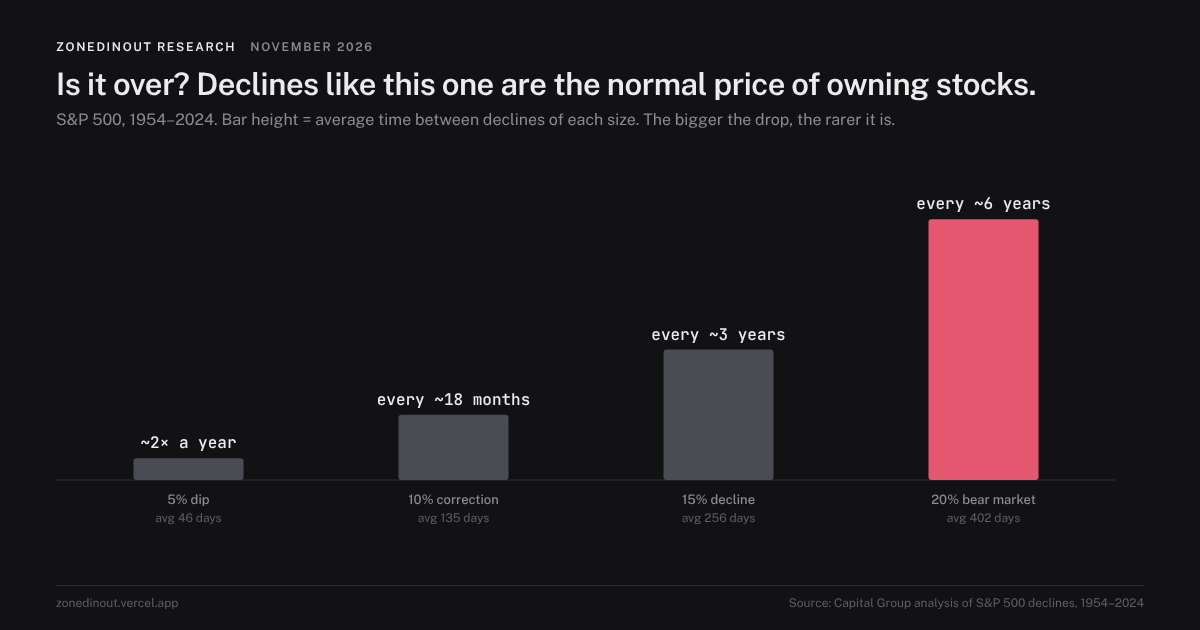
Capital Group studied every S&P 500 decline from 1954 to 2024 (source):
| Size of decline | How often, on average | Average length |
|---|---|---|
| 5% or more | about twice a year | 46 days |
| 10% or more (correction) | about every 18 months | 135 days |
| 15% or more | about every 3 years | 256 days |
| 20% or more (bear market) | about every 6 years | 402 days |
Most corrections stop being corrections. Carson Investment Research counts 12 of 48 post-war S&P 500 corrections that went on to become bear markets, about 25% (Carson). Measured since 1929 the figure is closer to 39% (CFRA via Covenant).
What usually turns a correction into a bear market
The dividing line in history is a recession. Bear markets that came with a recession averaged roughly −36% to −43%. The ones without one averaged roughly −18% to −28% and were much shorter (Invesco, LPL via Benzinga).
Checking today's recession signals:
| Signal | Latest | Reads as |
|---|---|---|
| Q3 GDP (advance) | +3.4% annualized (BEA) | No recession |
| ISM manufacturing, October | 55.5 | Expanding |
| S&P 500 Q3 earnings growth | +30.2%, 82% beat (FactSet) | Strong |
| High-yield credit spread | 3.32% on Nov 4, peak 3.44% Oct 30 (FRED) | Calm. Recession bears usually see 5%+ |
| October payrolls (released Nov 6) | +165,000, unemployment 4.1% (CNBC, BLS) | Strong. September revised up to +60,000 |
| Consumer sentiment (UMich) | 48.0 | Near record lows |
Five of six say "no recession." Only sentiment doesn't. Hiring looked like the weak spot until the October report beat forecasts by more than 100,000 jobs, though the broader underemployment rate did rise to 7.9%.
The bear case deserves a fair hearing
- Valuation. The Shiller CAPE is about 40, against 44.2 at the 2000 peak (GuruFocus).
- Concentration. J.P. Morgan puts the top 10 stocks at about 40.8% of the S&P 500, versus 26.6% at the dot-com peak (J.P. Morgan).
- The Fed is hiking, not cutting. It raised rates in September and held on October 28 with two votes for another hike. Markets price roughly an 80% chance of a December hike. See our Fed note.
- The shock is internal. DeepSeek in January 2025 and the April 2025 tariff selloff came from outside and healed within months. This time the question is whether AI spending pays back, which looks more like the telecom buildout of 2000. We go through the money side in AI's problem is financing, not demand.
Seasonality, for what it's worth
The S&P 500 has been higher 12 months after all 19 midterm elections since 1950, by about 15% on average (Hartford Funds). November to April has historically been the strongest six-month stretch. Nineteen data points is a small sample and the pattern isn't a cause of anything. Treat it as a mild tailwind, not a promise.
What we see in our own data
The index hides a lot. At the November 5 close the S&P 500 ETF was 5.9% off its 52-week high, but 107 of the 172 stocks we track (62%) were 20% or more below their own highs. That's a bear market for the median stock, and we cover it in the hidden bear market. Money is moving, not leaving: consumer staples, health care and financials closed at 52-week highs on November 4, and on November 5 staples fell only 0.75% while tech fell 8% (rotation note).
What would change the answer
We'd take the bear case much more seriously if any of these show up:
- Hiring rolling over while the Fed still hikes. The October report (+165,000) went the other way, which takes recession risk down but makes a December hike more likely.
- High-yield spreads above about 4%, meaning the stress at AI borrowers like CoreWeave is spreading.
- Nvidia's November 17 guidance, or any hyperscaler cutting its 2027 spending plan.
None of those has happened as of the November 5 close. Volatility has picked up: the VIX closed at 28.2, above the 25 level our macro banner treats as a caution sign. Until one does, history favors a correction that runs its course over months, with leadership rotating away from AI hardware, not the end of the bull market. That's a base rate, not a forecast, and base rates fail about a quarter of the time.
Not investment advice. Sources are linked inline; market levels are closing prices unless marked intraday.
Scores in this piece come from the ZonedInOut model. How the score works →
Frequently asked
Is the stock market going to crash in November 2026?
Is the Nasdaq in a correction?
How often does the stock market fall 10%?
What happens to stocks after midterm elections?
Get the Sunday Brief
One email a week, before the open: what the board did, which calls worked, which didn't, and what changed. Free. No spam, unsubscribe anytime.