We Added a 'Falling Knife' Warning in August. Our Own Data Says It Was Backwards Until October.
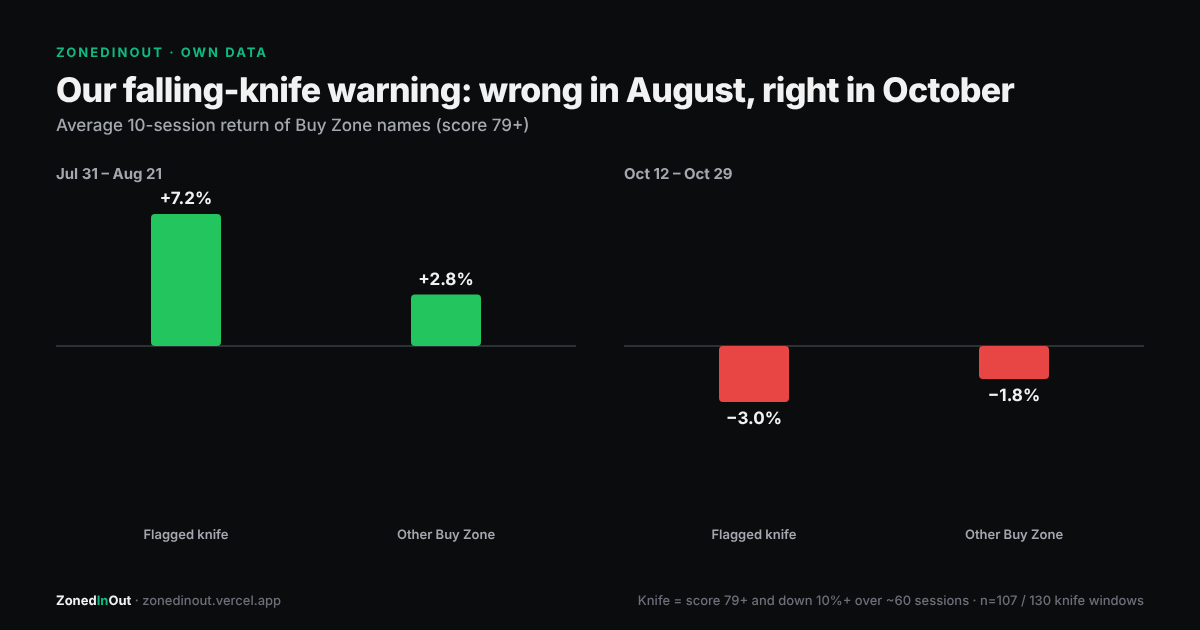
This audits one of our own features against our own snapshots. The knife flag shows on any Rankings row with a Buy Zone score (79+) whose price is also down 10% or more over roughly the last 60 sessions. It doesn't change the score; it's a separate badge. We only started recording the 60-session return on July 31, so the summer side of this test covers July 31 to August 21: 16 snapshots.
The test
For every Buy Zone snapshot, we checked the price ten sessions later and compared flagged knives with every other Buy Zone name over the same dates.
| Window | Flagged knives: avg 10-session return | Win rate | Other Buy Zone | Win rate |
|---|---|---|---|---|
| Jul 31 – Aug 21 | +7.18% (n=107) | 72.0% | +2.80% (n=473) | 58.6% |
| Oct 12 – Oct 29 | −3.05% (n=130) | 42.3% | −1.80% (n=428) | 44.9% |
The 5-session numbers point the same way: in August knives averaged +4.37% against +1.54% for other Buy Zone names. In October, −1.92% against −0.83%.
What that means
In August the warning was pointing at the best trades on the board. Names that had dropped hard and then reached a high score bounced the most. That's classic mean reversion: the deeper the hole, the bigger the snap-back.
In October it flipped. The same pattern became the worst group on the board, because the market stopped bouncing losers (see our score-tier audit).
So the flag wasn't wrong or right in general. It was wrong in one regime and right in the other.
Who's flagged right now
34 Buy Zone names carry the knife flag as of October 29. The deepest 60-session drops among them:
| Name | Score | 60-session change |
|---|---|---|
| LCID | 83 | −54.2% |
| CBRS | 97 | −45.5% |
| ASTS | 81 | −36.1% |
| CLSK | 94 | −35.7% |
| RIOT | 90 | −35.2% |
| ENPH | 91 | −34.8% |
| MARA | 93 | −32.7% |
| SE | 93 | −31.0% |
What we're doing
The flag stays. It never changed the score; it tells you the pullback comes on top of a bigger decline, and you should know that either way. What's changing is the wording: the flag means "higher variance," not "avoid." It was the best group in August and the worst in October. That's what a knife is: a bigger bet in whichever direction the market turns.
The sample is small: 107 and 130 knife windows, overlapping. We'll re-run this at the end of November.
Scores in this piece come from the ZonedInOut model. How the score works →
Frequently asked
What is the falling-knife flag on ZonedInOut?
Do falling-knife stocks bounce or keep falling?
How many stocks are flagged as falling knives right now?
Get the Sunday Brief
One email a week, before the open: what the board did, which calls worked, which didn't, and what changed. Free. No spam, unsubscribe anytime.