The S&P 500 Is 6% From Its High. Most Stocks We Track Are 20% From Theirs.
The headline index makes this market look calm. Underneath it, more than half the stocks we follow are already in their own bear markets.
Updated November 6 with the November 5 close and the October jobs report.
Everything below comes from our daily snapshot at the November 5, 2026 close, the day the S&P 500 fell 4.36%: 172 tracked stocks, each compared with its own 52-week high.
The split
| Distance from 52-week high | |
|---|---|
| S&P 500 ETF (SPY) | −5.9% |
| Nasdaq-100 ETF (QQQ) | −14.8% |
| Median tracked stock | −27.3% |
| Median tracked crypto asset | −46.6% |
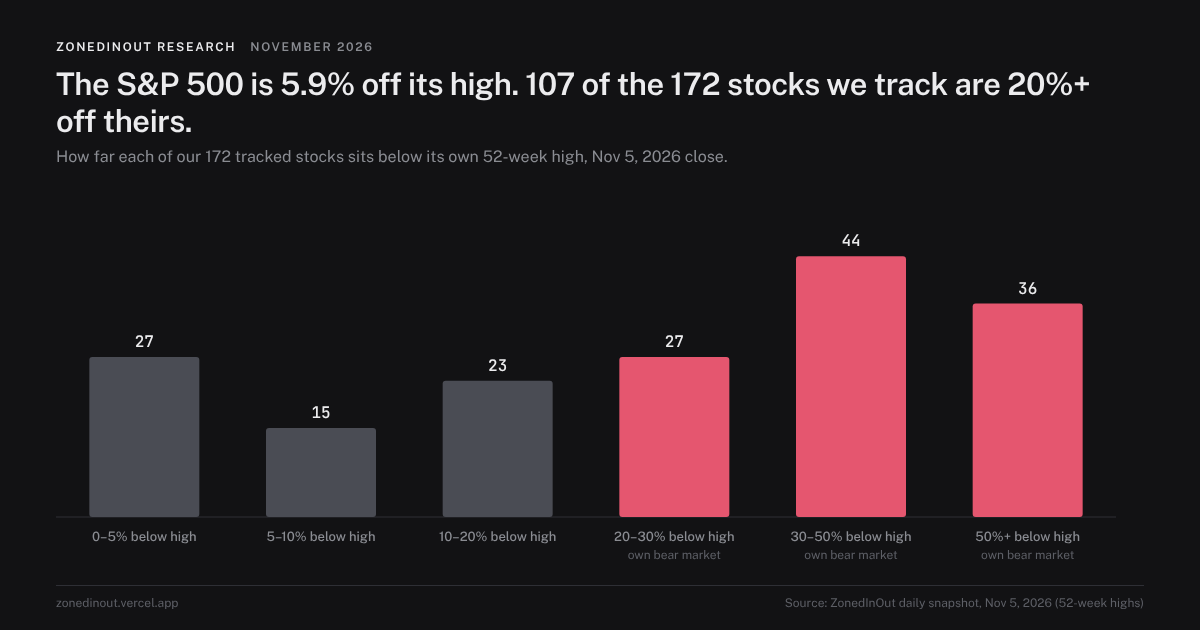
How the 172 stocks are spread out:
| Below their 52-week high by | Stocks |
|---|---|
| 0–5% | 27 |
| 5–10% | 15 |
| 10–20% | 23 |
| 20–30% | 27 |
| 30–50% | 44 |
| 50% or more | 36 |
107 stocks (62%) are 20% or more off their highs, the usual line for a bear market. 36 are down by half or more. Only 27 are within 5% of a high. On November 4 the share past −20% was 53%; one day took it to 62%.
Why the index doesn't show it
The S&P 500 is weighted by size. When a handful of very large companies hold up, the index holds up, however many smaller names are sliding. On November 4, Apple and Microsoft both closed at 52-week highs in our data, and after the November 5 rout they were still only 1.5% and 3.6% below them. Those two alone carry more index weight than dozens of the stocks in the worst buckets above.
J.P. Morgan estimates the top 10 stocks are about 40.8% of the S&P 500, compared with 26.6% at the 2000 peak (J.P. Morgan). At that level of concentration the index tells you mostly about ten companies.
Is it getting worse?
Yes. On a fixed set of stocks we've tracked since summer, the median distance from a 52-week high went from about −17% on August 21 to about −21% to −23% across late October and early November, and −27% on November 5. The share above their 200-day average fell from 68% in August to 49% on November 2–3 and 40% on November 5. That day only 23 of the 227 assets we track rose; 204 fell.
One caveat: our tracked list leans toward growth, tech and higher-volatility names, the part of the market hit hardest right now. A broad index of all US stocks would probably look less extreme. The direction would be the same.
Where the damage is
The deepest holes are in AI hardware and infrastructure. Over the 20 sessions to November 5, Lumentum is down 53.8%, Marvell 51.5%, Intel 50.1%, SanDisk 49.0% and CoreWeave 46.8%. We break that down in AI's problem is financing, not demand.
The other side is just as clear. Staples, health care and financials closed at 52-week highs on November 4 and are still within 3% of them, which is in our rotation note.
What to do with this
- Don't read the S&P 500 as "everything is fine." If you own individual growth stocks, your portfolio may already be in a bear market even though the index isn't.
- A cheap-looking board isn't automatically a buying opportunity. Many of our highest scores right now are stocks in the deepest buckets above. Our archive says buying those right after a sharp drop has usually been early this autumn.
- Watch the median, not the average. We publish market breadth on the Rankings page every day.
Data: ZonedInOut snapshot of Nov 5, 2026. 52-week highs come from daily closes. Not investment advice.
Scores in this piece come from the ZonedInOut model. How the score works →
Frequently asked
Are most stocks in a bear market in November 2026?
Why is the S&P 500 only about 6% off its record when most stocks are down 20%+?
What is the median stock drawdown right now?
Get the Sunday Brief
One email a week, before the open: what the board did, which calls worked, which didn't, and what changed. Free. No spam, unsubscribe anytime.